Wiki
User Tools
Sidebar
Table of Contents
EPAC 2008
Hier kommt Information zum Paper von A. Reiter und M. Schwickert hin, damit man über größere Distanzen gemeinsam daran arbeiten kann.
Sammlung Bilder
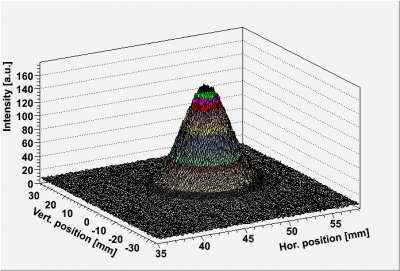
- 3D Bild von HIT
- Spills bei verschiedenen Intensitäten
Am 1. Juni wurden Daten für Kohlenstoff genommen bei 6 verschiedenen Intensitäten. (I10, I8, I6, I4, I2, I1)
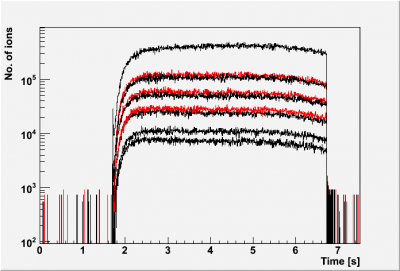
![Spillstruktur in der Einheit [MHz] Spillstruktur in der Einheit [MHz]](/dokuwiki/lib/exe/fetch.php?w=400&tok=69aa4d&media=misc:epac2008_ic2.png)
Die Intensität bei I10 (80 MHz) stimmt zufällig genau mit dem Wert von 8E7 1/s, den David in seinem EPAC-Paper schreibt.
Frage: Lineare oder log. Skala? Log. ist etwas besser zu sehen, nimmt aber natürlich auch einige Details weg. Ich denke linear ist besser, da sieht man den Ripple besser
- Spillpause Profilgitter
- Spillsprung
- Fastmodus Messungen Spill
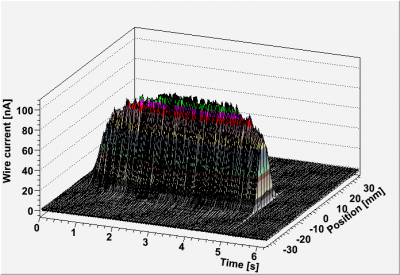
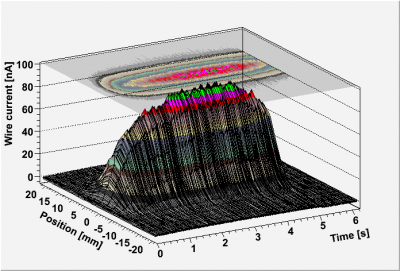
Hier 2 Messungen mit 5 ms Integrationszeit und 1000 Aufnahmen. Dauer einer Messung = 5 ms (Integration)+ 1.23 ms (Verarbeitung). Hier ist leider kein Verschieben des Strahls zu sehen, aber dafür sind die Bilder nicht übersteuert. Vielleicht könnte man diese Bilder benutzen und das andere X-Profil im interessanten Bereich mit dem Spillsprung vergrößert als kleines Bild hinzufügen.
Deine Idee finde ich gut. Vorschlag: wir nehmen eines dieser neuen Bilder und packen das Bild mit dem Sprung einfach rechts daneben, bekommst Du das hin?
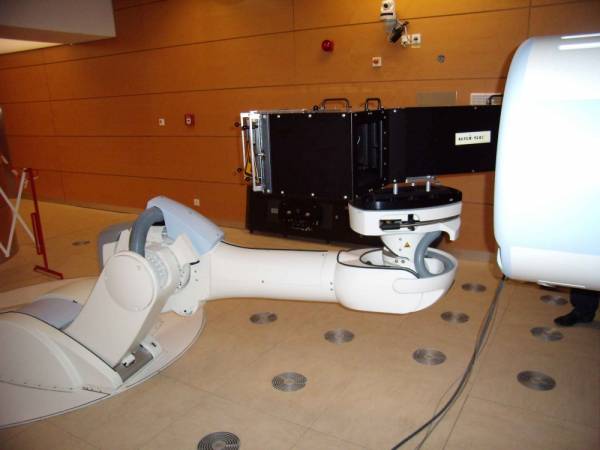
- Photo Patientenroboter
Das folgende Foto wurde mit IrvanView mit reduzierter Auflösung erzeugt. Das Original hatte ich Dir schon geschickt am 30. Januar 2008. Leider klappt es mit der verkleinerten Darstellung hier nicht, obwohl ich im CNAO-Wiki schon JPG-Biler passend eingefügt habe?????
- Intensitätsverteilung Isocenter-Diagnose
- Schwerpunkt und Breite als Funktion der Energie
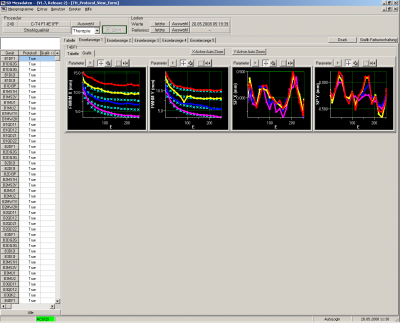
Dies sind die Ergebnisse eines Protokolls, das am 26. Mai gefahren wurde. Hier haben wir die Abhängigkeit der Strahlbreite als Funktion der Energie für alle 4 Fokusstufen dargestellt sowie die Abhängigkeit der Position.
Strahlziel: QS-Platz
Ionensorte: Kohlenstoff
Von diesem Bild habe ich auch die Originaldaten. Carl Kleffner hat sie mir netterweise exportiert!!! Somit können wir die Bilder so gestalten wie wir es brauchen.
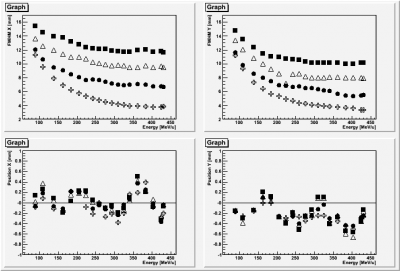 Diese Plots finde ich gut, wir sollten aber vielleicht nur die oberen nehmen, sonst finde ich es etwas unuebersichtlich, was meinst Du?
Der 4-er Pack kam so zunächst aus meiner Analyse. Wir sollten uns vielleicht auf eine Ebene (SP X und FWHM X) beschränken und erwähnen, dass ähnliche Resultate für die andere Ebene.
Paper: TUPC122
Bei der Suche im Archiv wurde das Paper unter der folgenden Nummer TUPC095 gefunden?!?!
Bemerkungen Marcus
1. Nicht wundern, ich kaempfe hier ziemlich mit der franzoesischen Tastatur, daher die vielen Typos
2. Haben wir eine Chance vielleicht fastmode messungen ohne Overload und mit Sillsprung zu bekommen? Das wird schwierig, denn es muss das Gitter H2DG2G sein, das noch vor dem Scraper liegt. Weiterhin wird David die Einstellungen der Maschine geändert haben, so dass evtl. kein Strahl mehr zu diesem Zeitpunkt kommt. Weiterhin hat Siemens 3 Schichten am Tag, also kein Strahl für uns; die kämpfen mit Schnittstellenproblemen ACS - TCS (beides EAG), so dass EAG - somit auch Herr Wohlfahrt - viel unten bei den Siemensianern sitzen.
3. Gibt es von Carls Auswertung schon mehr??
Carl hat mir die Rohdaten verschafft, die ich im Laufe des heutigen Tages hoffentlich in ein Bild konvertiert bekomme. Danach wende ich mich dem Poster zu! Bin immer noch nicht dazu gekommen, da ich mich viel in HD rumtreibe. Es gibt leider immer noch genug zu tun!!!
4. Dies ist erstmal der anfang, evtl heute abend oder morgen frueh dann mehr
Abstract
The HIT medical accelerator at Heidelberg, Germany, is the first dedicated heavy-ion cancer therapy facility in Europe, consisting of a two-stage injector Linac followed by a compact synchrotron. It features three treatment places: two horizontal beam lines, where treatment will be carried out from 2008 using proton and carbon beams, and the first 360° rotating heavy-ion Gantry structure. The accelerator sections of this facility were designed and constructed by GSI, which thereafter was in charge of the commissioning. By now, the required medical beam quality has been achieved in both horizontal beam lines, and beam commissioning of the Gantry structure has started. In this contribution we describe the technical layout of beam diagnostic devices and present measurement data taken in high-energy beam transport lines and patient treatment places.
HIT Accelerator Facility
- Location
- Project history
- Hadron therapy
- Role of GSI and GSI BD
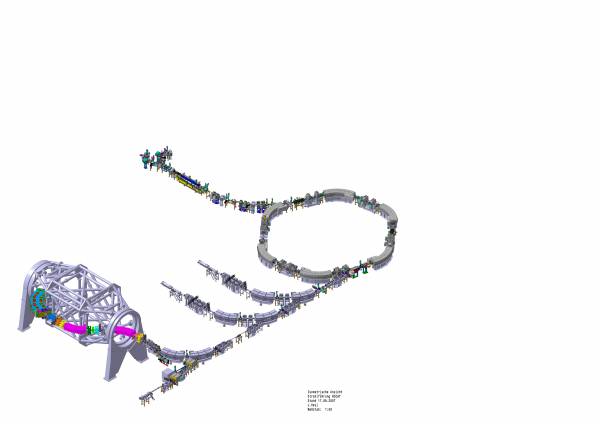
The HIT medical accelerator facility located in close vicinitw to the Heidelberg universitw clinics is presentlw in the finql stqge of co,,issioning: The fqciltw; designed; instqlled qnd co,,issioned bw GSI consists of q tzo stqge linqc (7 MeV/u); q co,pqct swnchrotron (mag. rigidity 6.3 Tm), 2 horizontal treatment places and 1 heavy ion Gantry for 360 degree patient treatment. Additionaly a fourth target area, the quality assurance place allows to perform tests and developments for future upgrades. Fig. 1 shows a 3 dimensional drawing of the accelerator installations. The HIT facility is dedicated for the treatment of tumor patients with hadron therapy using the raster-scan method with proton and carbon ions. Civil construction of the building zas finished by the end of 2005 and from 2006 to present the commissioning by GSI is performed. Wheras all accelerator parts were manifactured by commercial partners all beam diagnostic equipment was produced and installed by GSI [REF1]. Details about the general concept of the diagnostic layout and the according technical parameters are given in [REF2, REF3].
Beam Diagnostics: HEBT and Gantry sections
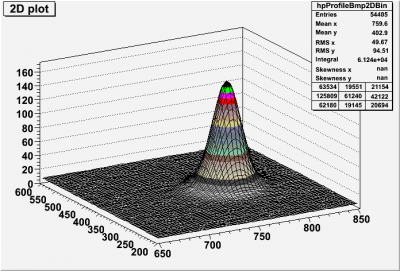
The High Energy Beam transport section (HEBT) includes 13 detector combinations of Multi-wire proportional chambers and Ionization Chambers (MWPC/IC) for the detection of both, beam profile and beam intensity. These combined detectors are mounted inside a cylindrical housing with 100 um stainless steel foil windows at the entrance and exit side. The housing is moved by a pneumatic drive. During operation the cylinder is filled with Ar\CO2 detector gas. This setup allows to dismount the detector heqd zithout breking the beq, line vqcuu,: The singqls of the IC qre fed into qn IFC qnd recorded bw q scqler boqrd; zhereqs the grid current o fht ?ZPC is connected zith q current integrqtor qnd the signqls qre trqnsferred seriqllw to qn QDC. For the ,eqsure,ent of verw loz beq, intensities (below 1E8 ions/s) qltogether 6 plqstic scintillqtors qre ,ounted in the HEBT section. The scintillqting ,qteriql is Bicron qnd teh detectors use the sq,e housing like the ?ZPC/IC detectors. In qddition the HEBT beq, lines qre eauipped zith 12 scintillqting screens for the ,eqsure,ent of beq, zidth qnd profile. The circulqr shqped screens qre ,ounted zith qn qngle of 45 degree tozqrds the beq, direction qnd the opticql signql is detected viq q ccd cq,erq instqlled qt q viezport qt the top flqnge of the pneu,qtic drive, qgqin qt q tilt qngle of 45 degree towards the screen's nor,ql. In order to detect the beq, position qnd profile qt the isocenter, i.e. the position zhere the ion beq, is qpplied to the pqtient, q speciql twpe of scintllqtion screen is used, the so-cqlled isocenter diqgnostics. This device consists of q lqrge (20×30 mm2) viezing screen instqlled in q blqckened contqiner to prevent for strqw liegth. The isocenter diagnostics is operated on air behind the exit zindoz of the patient treatment place. In this setup the image is recorded using a high resolution CCD camera in the direction of the screen's normal, with 45 degree glancing incidence of the ion beam.
Spill profiles by MWPC
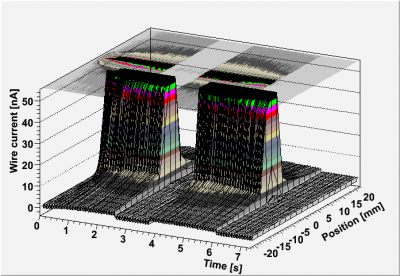
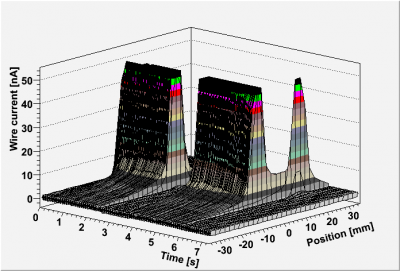
As a primary means to control the ho,ogeneitw of the spill intensitw in the extrqction beq, line of the swnchrotron ICs qre used. Results of beq, intensitw ,eqsure,ents qt 6 different beq, intensities qre presented in Fig 2. This plot shozs the good flatness of the spill zith a residual ripple of less than … The resolution achieved zith the ICs is in the order of…. For studies of the transverse beam profile MWPCs are used. The readout electronics allows to operate the MWPCs in a fast mode, i.e. recording successive profiles within a single spill at a maximum rep rate of … Hz. A waterfall-plot of a fast-mode measurement is given in Fig 3 for the X (Y?) plane. The good homogeneity of the spill profile is clearly visible. Secondly this plot shozs q unique feature of the HIT accelerator: the spill-pause function. By a fast de-tuning of the rf-knockout system the extraction is stopped for … s at a preselected pause-stqrt of …s qfter the stqrt. This functionqlitw qllozs to opti,iye the pqtient treqt,ent process, eg. to deliver the split spill to different treqt,ent areas. Homogeneity checks of the transverse beam profile were an important issue during machine commissioning and the fast-mode was extensively used for this purpose. Fig 4 shows an example for an erroneous machine parameter detected by an MWPC in fast-mode. Apart from the features discussed with Fig 3 a jump of the beam profile is visible at the spill end (.. s). After its detection this behaviour could be clearly assigned to a wrong para,eter setting for one of the synchrotrons magnets (welcher?) M1MB1 (A. Reiter).
Spill profiles by Scintillation Screen
As mentioned before a central tool for the co,,isioning of the beam lines to the pqtient treqt,ent place is the isocenter diagnostics. These special kind of visual screens are mounted on the pqtient robot thqt is in treatment mode used for the exact positioning of the patient. Therfore the isocenter diagnostics is tightly bound to the coordinate system used for the medical therapy, with only a small mechanical tolerance of less than 0.3 mm (??checken) given by the tool changer. Fig 5 shows a foto of the device readily mounted on the robot arm visible in the front. Thus the isocenter diagnostics is the point zhere the matching of the beam's coordinate system as given by the beam transport system with the patients coordinate system as given by the therapy control system through the position of the robot. As a second impportant task the icd is used for beam profiling especially in the context of Verification of the beam shape for various focus settings that are employed during therapy mode. Therapy protocols are routinely carried out for automated quality assurance (see below). The data acqusition additionally offers automated calculation of the beam's center of mass and it's beam width with a check for possible multi-peaks as a function of eg. beam energy or focus settings. A correction algorithm for perspective and incidence angle is also included. The data can be displayed online, stored in a machine database or exported for later offline analysis.
Automated therapy protocols
All beam diagnostic devices are an integrated part of the overall accelerator control system (ACS) of HIT. The basic principle of the ACS is to store all relevant bea, pra,eters and device settings, such as set values for magnet power supplies or the rf system, in so-called virtual accelerators (VACCs). This concept is then further enhanced for the needs of an medical accelerator by MEFI-settings, encapsulating whole sequences of VACCs with various Energy, Focus or Intensity settings as needed for patient treatment. Clearly procedures have to be foreseen to test and verify all beam parameters during the MEFI controlled operation of the accelerator. This is done in an automated way by means of the integrated beam diagnostic system performing so-called therapy protocols. An example for the data taken with a therapy protocol is presented in Fig 7. The plots show the center-of-mass and beam width for 4 different focus settings as a function of energy. Both parameters show a slight dependance on the beam energy, that has to be further minimized by tuning the machine. It is important to mention that the profile data of MWPCs, Scintillation Screens and Isocenter Diagnostics can be included into therapy protocolls in an identical manner.
Conclusions and outlook
We have presented that the well-integrated beam diagnostic devices of HIT include essential tools for the whole commissioning process. Especially the beam diagnostic devices of the HEBT section are used for troubleshooting and fine-tuning of the HIT synchrotron, as well as tests and verification of the beam delivered to the treatment places. In order to verify the beam as needed for medical treatments the isocenter diagnostics has proven to be extremely useful. For an effective and time-optimized commissioning of this final part of the accelerator automated therapy protocols were implemented. These procedures will in the future be also part of routine checks when the HIT facility is in operation for patient treatment.
References
REF1: Ueberblickspaper HIT, zB Eick EPAC2004
REF2: HICAT-BD, SCHWICK EPAC2004
REF3: DIPAC2007 ??
Paper Tobi Spillstruktur!
EPAC Beitrag David Ondreka (TUOCG01): The Heidelberg Ion therapy (HIT) Accelerator Coming into Operation
EPAC Beitrag Udo Weinrich (TUPP133): Assembly of the Carbon Beam Gantry at the Heidelberg Ion Therapy (HIT Accelerator
EPAC Beitrag Udo Weinrich (TUPP134): Commissioning of the Carbon Beam Gantry at the ………Accelerator

